
Recently, I worked on a database monitoring project aimed at expanding my perspective and experience as a DBA. Database administration and support go beyond the moments when we are directly connected to the databases, and to meet this need, monitoring is employed, covering both the database itself and the host where it is running, as well as other related systems and services.
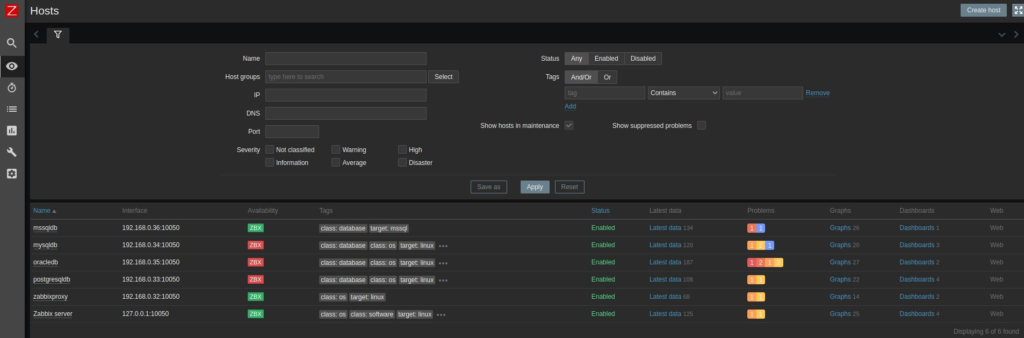
In my own lab, I virtualized several machines, using systems based on Windows (Windows Server 2019) and Unix/Linux (Oracle Linux 7.9 and Ubuntu Server 22.04), along with some of the most widely used relational DBMSs on the market (Oracle 21c, PostgreSQL 14.7, MySQL 8.0, and SQL Server 2019), as well as monitoring software (Zabbix 6.0 and Grafana 9.5.2).
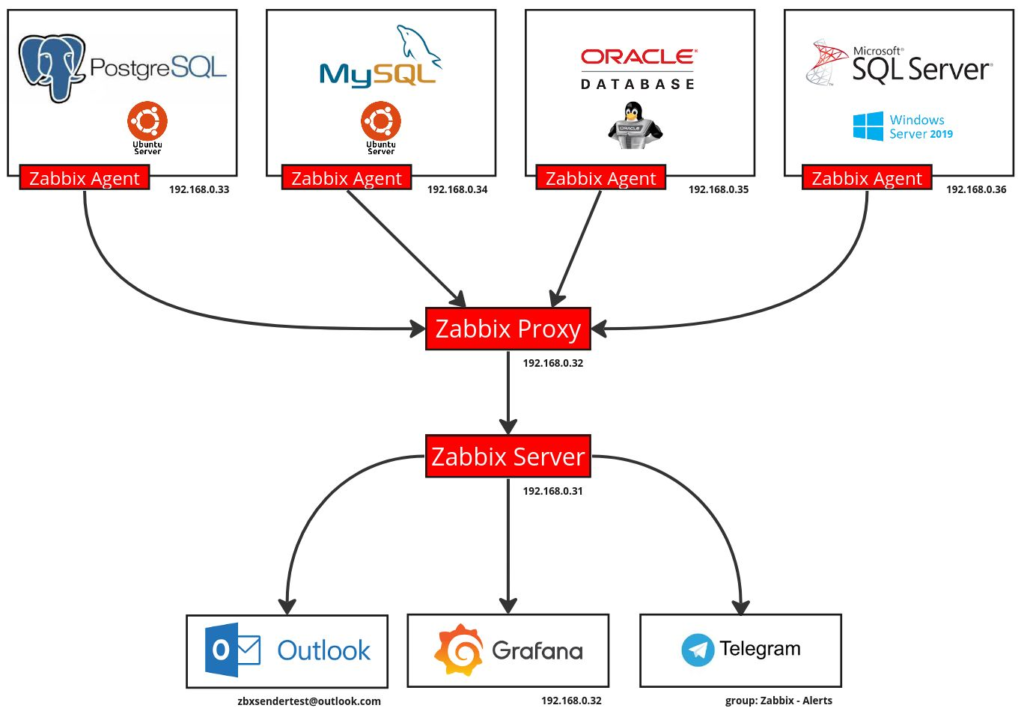
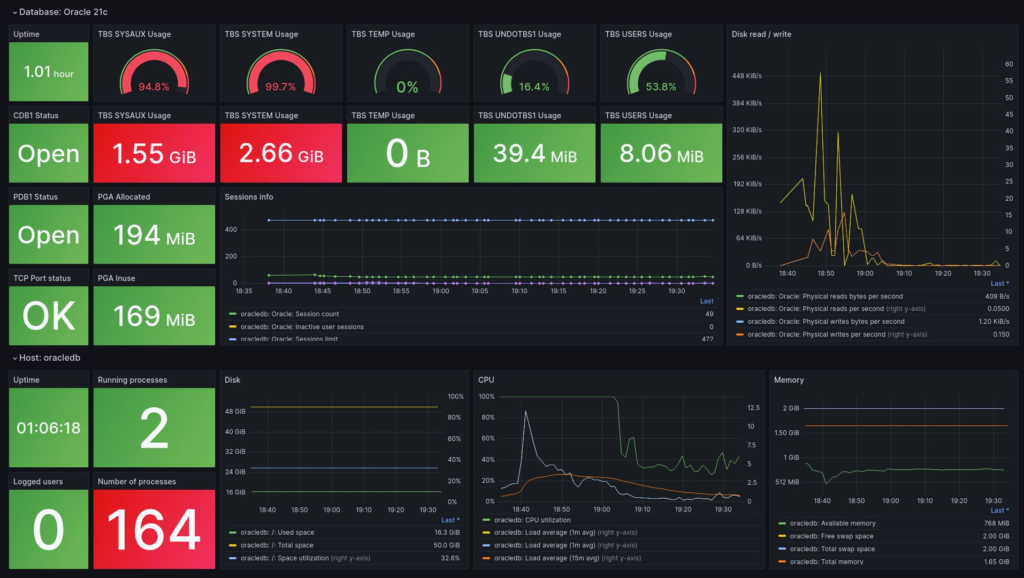
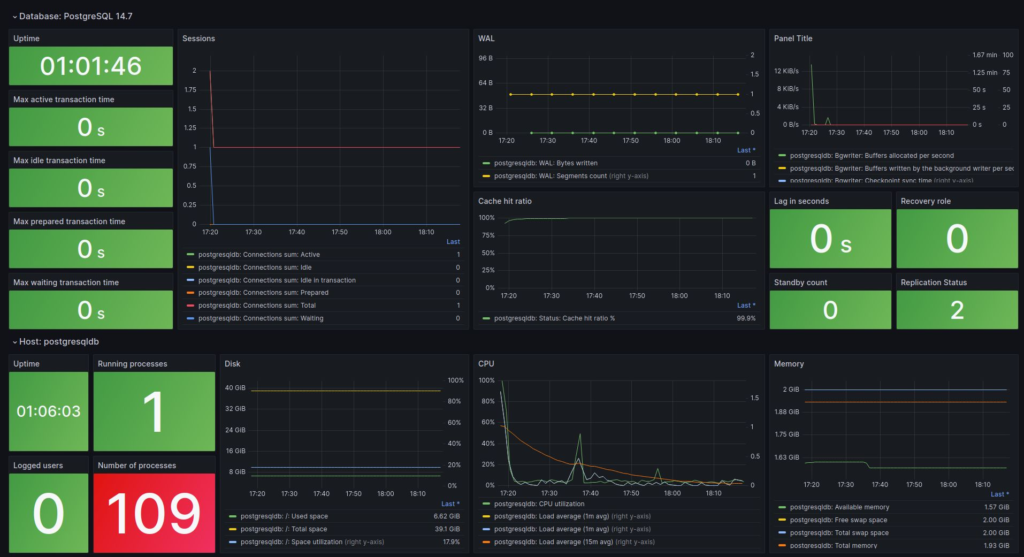
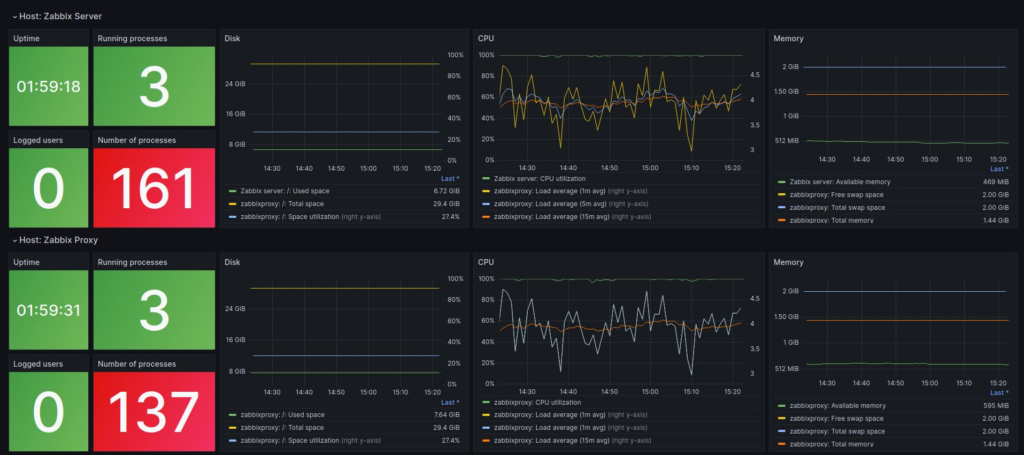
The idea was to implement the databases and monitor them using the Zabbix + Grafana integration, in order to have alerts and customized dashboards. The monitoring of database operations is carried out by Zabbix, and in the event of predefined alerts, notifications are sent to Telegram (group) and to a messaging system (email – Outlook). The dashboards created in Grafana, which are fed by data collected from Zabbix, make it easier to track key performance metrics and resource usage of the hosts and databases.
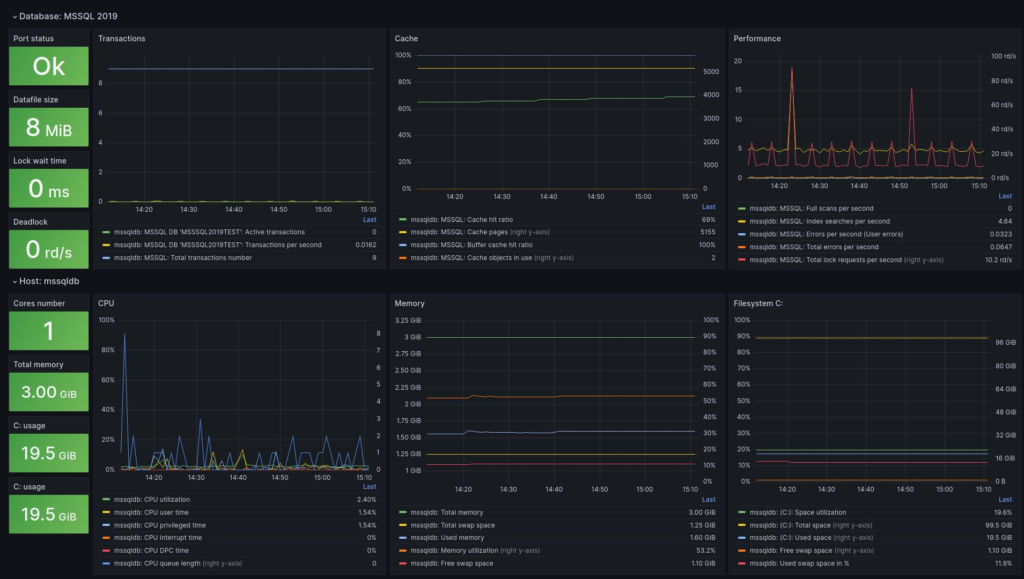
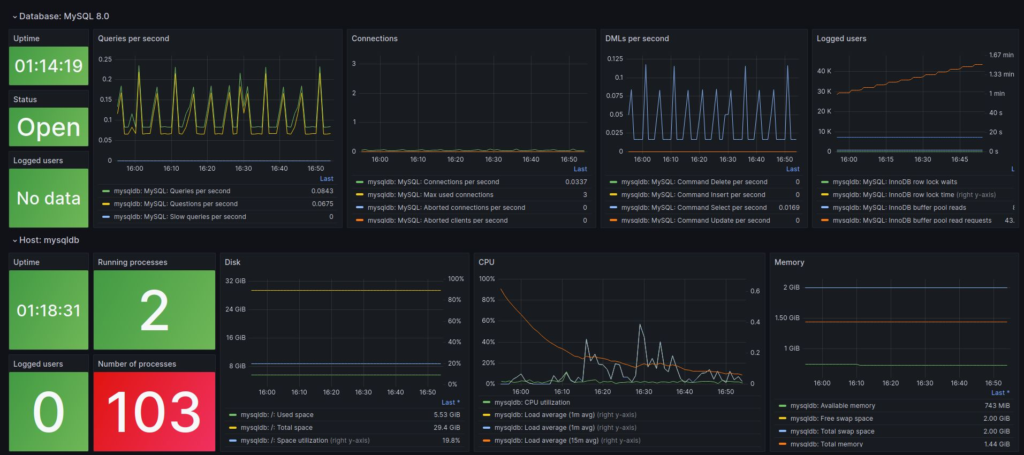
By using monitoring, we can fix occasional issues, retain information to understand the behavior of the resources in use, and thus assess needs, and even attempt to predict system behavior in order to avoid unnecessary potential risks.
References
Linkedin: Database environment monitoring with Zabbix and Grafana